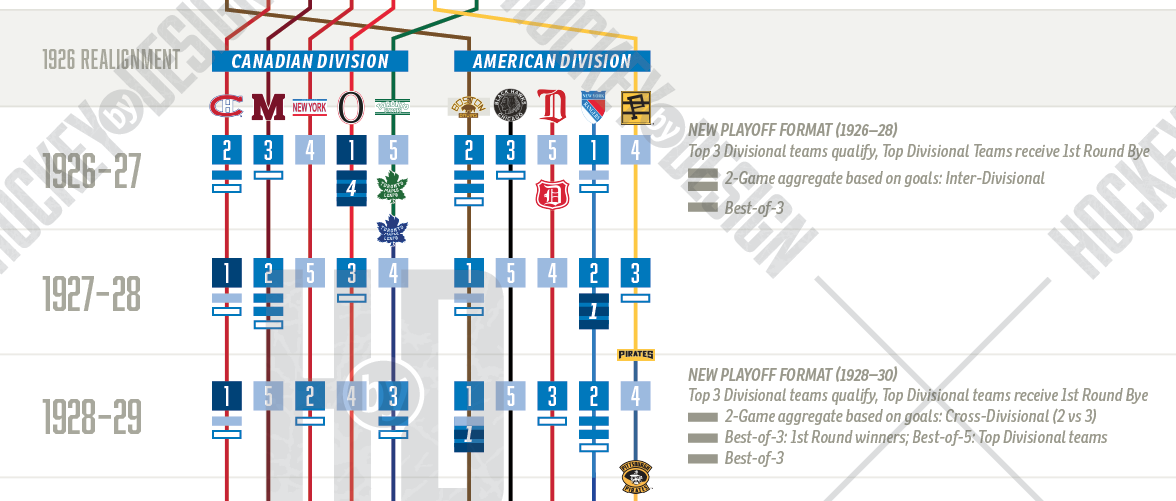
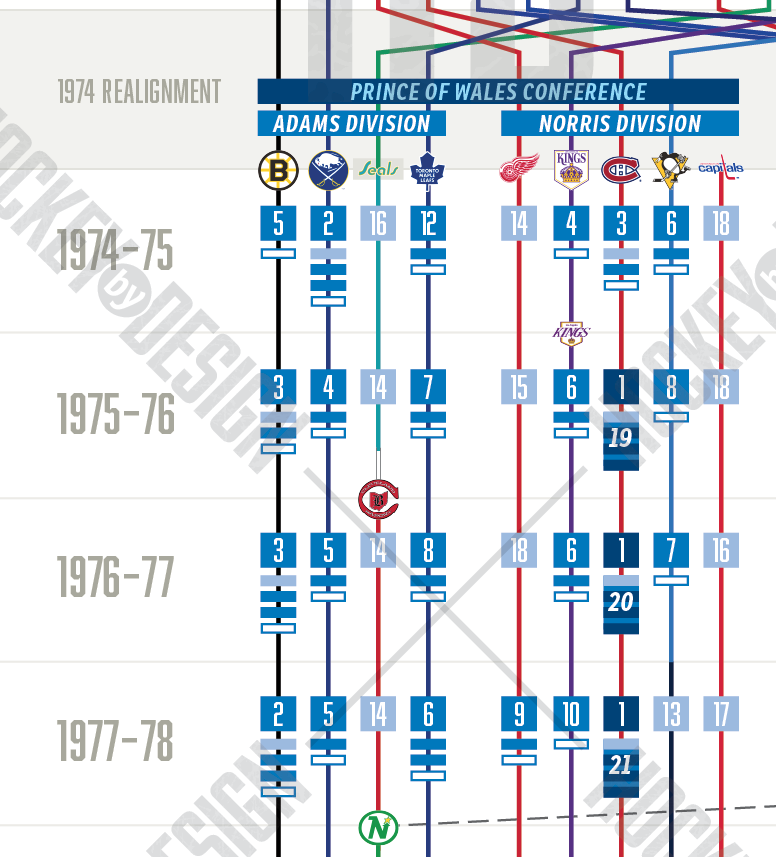
If you consider yourself an NHL history buff, there is no easier way to fact check your knowledge than with this insanely elaborate infographic.
The NHL is in its 100th season, which would make it pretty difficult for any hockey fan to know anytime a team changed their logo, when a new team was introduced to the league, the results of the regular season and playoffs and many other notes as the league has progressed. Luckily, all the information has been collected and presented in an easily digestible format.
As you can imagine, it’s pretty huge, so we've put some clippings of the best parts first. You can also download the graphic directly from Hockey By Design’s blog, which will give you an easier to access and navigate file. They also provide some more information on how to understand the graphic, but there's also a legend on the side of the full version, which you can find below.


The only thing the chart seems to be missing is the monumental moment from last season, when Phil Kessel became a Stanley Cup Champion.


